Showing posts with label R Beginners. Show all posts

Friday, July 19, 2013

Using R and Shiny to create “Art”

One big strength of packages like shiny is the ability to easily vary parameters and view the results, especially in plots.

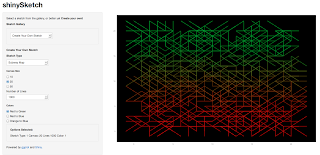
So here’s a small shiny app that I created to learn about reactivity, while also having fun.


The idea is simple. Vary many aspects of geom_segments in ggplot, and see what emerges. The things that I played with are canvas size, line origin and destination, line length, the angle and the colors.

Because it is art, I made the background black.

There were many experiments that didn’t appeal to me aesthetically. Others seemed very repetitive. The ones that seemed okay, I kept.

Take a look at the shiny app ShinySketch.

here:

The code can be found on github.

Tuesday, April 2, 2013

R Beginners - Plotting Locations on to a World Map

This post is targeted at those who are just getting started plotting on maps using R.

The relevant libraries are: maps, ggplot2, ggmap, and maptools. Make sure you install them.

The Problem

Let's take a fairly simple use case: We have a few points on the globe (say Cities) that we want to mark on the map.

The ideal and natural choice for this would be David Kahle's ggmap package. Except that there is a catch. ggmap doesn't handle extreme latitudes very well. If you are really keen on using ggmap, you can do it by following the technique outlined in this StackOverflow response.
 If ggmap is not mandatory, there are simpler ways to do the same.

First, let's set up our problem. We'll take 5 cities and plot them on a world map.


Method 1: Using the maps Package


This results in:

Which might be enough. However, if you take the few extra steps to plot using ggplot, you will have much greater control for what you want to do subsequently.

Method 2: Plotting on a World Map using ggplot 


This results in:

Monday, March 25, 2013

R - Defining Your Own Color schemes for HeatMaps

This post is intended at those who are beginners at R, and is inspired by a small post in Martin's bioblog.

First, we plot a "correlation heatmap" using the same logic that Martin uses. In our example, let's use the Movies dataset that comes with ggplot2.

We take the 6 genre columns, and we can compute the correlation matrix for those 6 columns.
Here's what the matrix looks like:

> cor(movieGenres) # 6x6 cor matrix
                  Action   Animation      Comedy        Drama
Action       1.000000000 -0.05443315 -0.08288728  0.007760094
Animation   -0.054433153  1.00000000  0.17967294 -0.179155441
Comedy      -0.082887284  0.17967294  1.00000000 -0.255784957
Drama        0.007760094 -0.17915544 -0.25578496  1.000000000
Documentary -0.069487718 -0.05204238 -0.14083580 -0.173443622
Romance     -0.023355368 -0.06637362  0.10986485  0.103545195
            Documentary     Romance
Action      -0.06948772 -0.02335537
Animation   -0.05204238 -0.06637362
Comedy      -0.14083580  0.10986485
Drama       -0.17344362  0.10354520
Documentary  1.00000000 -0.07157792
Romance     -0.07157792  1.00000000


When we plot with the default colors we get:
It is difficult to see the details in the tiles. Now, if you want to better control the colors, you can use the handy colorRampPalette() function and combine that with scale_fill_gradient2.
Let's say that we want "red" colors for negative correlations and "green" for positives.
(We can gray out the 1 along the diagonal.)

Doing this produces:

If there are values close to 1 or to -1, those will pop out visually. Values close to 0 are a lot more muted.

Hope that helps someone.

References: Using R: Correlation Heatmap with ggplot2


Monday, March 18, 2013

R - Simple Recursive XML Parsing

This is intended for those who are starting out in R and interested in parsing an XML document recursively. It uses DT Lang's XML package.

If you want to just read certain types of nodes, then XPATH is great. This document by DT Lang is perfect for that.

However, if you want to read the whole document, then you have to recursively visit every node. Here's the way I ended up doing it. The generic function visitNode could be useful if you are just starting out reading XML in R.

The full code, along with a sample XML file to test it is here.


Friday, December 2, 2011

O'Reilly's Data Science Kit - Books

It is not as if I don't have enough books (and material on the web) to read. But this list compiled by the O'Reilly team should make any data analyst salivate.

http://shop.oreilly.com/category/deals/data-science-kit.do

The Books and Video included in the set are:

  1. Data Analysis with Open Source Tools
  2. Designing Data Visualizations
  3. An Introduction to Machine Learning with Web Data (Video)
  4. Beautiful Data
  5. Think Stats
  6. R Cookbook
  7. R in a Nutshell
  8. Programming Collective Intelligence

Wednesday, November 30, 2011

Tips for getting started on Kaggle (datamining)

Ever since I heard about Kaggle.com at this year's Bay Area Data Mining Camp, I've wanted to participate. But I was feeling somewhat intimidated.
Jeremy Howard's "Intro to Kaggle" talk at yesterday's MeetUp (DataMining for a Cause) was exactly what I needed.
He had a number of tips for beginners. His was exactly the talk that I was looking for, though I didn't know it. I am sharing some of his tips here, in case it helps others as well.

Jeremy Howard's Tips for Getting Started on Data Mining competitions at Kaggle

* Visit the Kaggle site and spend at least 30 minutes every day hanging around. Read the forum, the competition pages, and read the Kaggle blog
* It is much better to start participating in competitions which are just starting up, rather than in ones where there are 100s of entries and teams already well on their way
* Aim to make at least one submission each and every day
* Jeremy himself participates in competitions to see where he stands, and to learn and get better
* He'd start out making trivial submissions (all zero's, or alternate zero's, all entries as averages) until his algorithm got better
* A lot of people who compete use R (and SAS, Excel or Python)
* Nearly 50% of the winning entries use Random Forest techniques.
* If you place in the top 3, that is great. But personal improvement and learning should be the goal.
* As you get better, you might get invited to "private competitions."
* Every day, strive to do a little better and improve your submission's performance, scoring and ranking

Related Links:
Monday, October 17, 2011

Get the Basics right - Suggestion for R Beginners

I am always looking for suggestions on how to get better at R, esp. for beginners. So when I see someone who's gotten adept at it, I ask them how they got there.

This weekend, at the Bay Area ACM Data Mining Camp, one person gave me what seemed like a good suggestion. Just wanted to share it here, for anyone else who's just getting started.

He told me that there are tons and tons of libraries, and if you start going down that path, you might know how to use a library or two, but you may not learn the basics of data manipulation, which is one of R's main strengths.

His suggestion:
Get some data and learn to manipulate it - understand the differences between vectors, data-frames, arrays and matrices. Once you have this down, only then should you start exploring the different libraries. Don't rush in to try every new library that someone praises.